Tour
See what each RTL Buddy workflow produces before you set one up. Every command below ran unchanged against rtl-buddy-project-template, and every table and image is that run's actual output. The project is a multi-clock APB-mapped ALU accelerator built from small leaf IPs, so one design carries the whole tour.
To follow along:
git clone https://github.com/rtl-buddy/rtl-buddy-project-template
cd rtl-buddy-project-template
uv sync --locked
uv run rb tool-check          # which flows your machine can run right now
rb tool-check lists each external tool and marks every rb subcommand ready or blocked. Only Verilator is needed for the first three sections; Installation maps the rest.
Run one test
A test is one named entry in a suite's tests.yaml. RTL Buddy resolves the model filelist, compiles, simulates, and grades the log.
cd verif/demo_tiny_alu
uv run rb test basic
Compiling basic
Running simulation basic
      Test Results Summary
┏━━━━━━━┳━━━━━━━━┳━━━━━━━━━━━━━┓
┃ Test  ┃ Result ┃ Description ┃
┡━━━━━━━╇━━━━━━━━╇━━━━━━━━━━━━━┩
│ basic │ PASS   │ (nwrn=  0)  │
└───────┴────────┴─────────────┘
       Builder: verilator
   Results: 1 PASS (1 total)
Artefacts land beside tests.yaml under artefacts/basic/: the compile and simulation logs, the FST trace, the generated filelist, and a result.json that records the verdict, builder, and run token. See Tests.
Run a regression
A regression is a list of suites with a level per test. The default level runs the sanity tier; -l 1000 adds the heavier demos.
uv run rb regression -c regression.yaml
                                    Regression Results Summary
┏━━━━━━━━━━━━━━━━━━━━━━━━━━━━━━━━━━━━━━━┳━━━━━━━━━━━━━━┳━━━━━━━━┳━━━━━━━━━━━━━━━━━━━━━━━━━━━━┓
┃ Suite                                 ┃ Test         ┃ Result ┃ Description                ┃
┡━━━━━━━━━━━━━━━━━━━━━━━━━━━━━━━━━━━━━━━╇━━━━━━━━━━━━━━╇━━━━━━━━╇━━━━━━━━━━━━━━━━━━━━━━━━━━━━┩
│ verif/apb/tests.yaml                  │ smoke        │ PASS   │ (nwrn=  0)                 │
│ verif/ip_cdc_sync/tests.yaml          │ smoke        │ PASS   │ (nwrn=  0)                 │
│ verif/ip_cdc_handshake/tests.yaml     │ smoke        │ PASS   │ (nwrn=  0)                 │
│ verif/ip_async_fifo/tests.yaml        │ smoke        │ PASS   │ (nwrn=  0)                 │
│ verif/demo_tiny_alu/tests.yaml        │ basic        │ PASS   │ (nwrn=  0)                 │
│ verif/demo_tiny_alu/tests.yaml        │ ops_sweep    │ PASS   │ (nwrn=  0)                 │
│ verif/demo_tiny_alu/tests.yaml        │ flags        │ PASS   │ (nwrn=  0)                 │
│ verif/demo_tiny_alu/tests.yaml        │ random       │ PASS   │ (nwrn=  0)                 │
│ verif/demo_tiny_alu_cocotb/tests.yaml │ cocotb_random│ SKIP   │ lvl 1000 > cmd end_level 0 │
│ verif/demo_tiny_alu_sc/tests.yaml     │ basic_sc     │ PASS   │ ED (0 errors)              │
│ verif/demo_tiny_alu_subsys/tests.yaml │ csr_smoke    │ SKIP   │ lvl 1000 > cmd end_level 0 │
│ verif/demo_axi_2x2/tests.yaml         │ basic_traffic│ SKIP   │ lvl 1000 > cmd end_level 0 │
└───────────────────────────────────────┴──────────────┴────────┴────────────────────────────┘
                                       Builder: verilator
                                       Builder Mode: reg
Rows above are a subset; the full run lists every suite. The same manifest runs a SystemVerilog suite, a SystemC cosimulation, and (at level 1000) cocotb suites, with one result table. Add --dispatch local-parallel or a Slurm backend to fan the suites out. See Regressions and Parallel dispatch.
Measure coverage
The cov builder mode compiles with Verilator coverage; rb cov then reads the saved artefacts without rerunning anything.
cd verif/demo_tiny_alu
uv run rb -M cov test basic ops_sweep flags random
uv run rb cov summary
                                    Coverage — Totals
┏━━━━━━━━━━━━━━┳━━━━━━━━━━━━━┳━━━━━━━━━━━━━┳━━━━━━━━━━━━━━━┳━━━━━━━━━━━━━┳━━━━━━━━━━━━━━┓
┃ Scope        ┃ Line        ┃ Branch      ┃ Toggle        ┃ Expression  ┃ Cover        ┃
┡━━━━━━━━━━━━━━╇━━━━━━━━━━━━━╇━━━━━━━━━━━━━╇━━━━━━━━━━━━━━━╇━━━━━━━━━━━━━╇━━━━━━━━━━━━━━┩
│ run          │ 41/55 (75%) │ 16/38 (42%) │ 276/316 (87%) │ 10/11 (91%) │ 22/22 (100%) │
│ basic        │ 41/55 (75%) │ 16/38 (42%) │ 159/316 (50%) │ 6/11 (55%)  │ 16/22 (73%)  │
│ flags        │ 37/55 (67%) │ 16/38 (42%) │ 261/316 (83%) │ 8/11 (73%)  │ 16/22 (73%)  │
│ ops_sweep    │ 41/55 (75%) │ 16/38 (42%) │ 234/316 (74%) │ 7/11 (64%)  │ 15/22 (68%)  │
│ random       │ 41/55 (75%) │ 16/38 (42%) │ 276/316 (87%) │ 10/11 (91%) │ 22/22 (100%) │
└──────────────┴─────────────┴─────────────┴───────────────┴─────────────┴──────────────┘
                                  Coverage — Coldest Files
┏━━━━━━━━━━━━━━━━━━━━━━━━━━━━━━━━━━━━━━━┳━━━━━━━━━━━━━━┳━━━━━━━━━━━━┳━━━━━━━━━━━━━━━━┳━━━━━━━━━━━━┓
┃ Scope                                 ┃ Line         ┃ Branch     ┃ Toggle         ┃ Expression ┃
┡━━━━━━━━━━━━━━━━━━━━━━━━━━━━━━━━━━━━━━━╇━━━━━━━━━━━━━━╇━━━━━━━━━━━━╇━━━━━━━━━━━━━━━━╇━━━━━━━━━━━━┩
│ common/lvm_core.sv                    │ 18/32 (56%)  │ 6/20 (30%) │ -              │ -          │
│ design/demo_tiny_alu/demo_tiny_alu.sv │ 10/10 (100%) │ 2/2 (100%) │ 122/122 (100%) │ 6/6 (100%) │
│ verif/demo_tiny_alu/tb_top.sv         │ 12/12 (100%) │ 8/16 (50%) │ 66/106 (62%)   │ 4/5 (80%)  │
└───────────────────────────────────────┴──────────────┴────────────┴────────────────┴────────────┘
The coldest file is the shared testbench macro library, not the design: the DUT itself is at 100% on every metric. rb cov module demo_tiny_alu narrows the same data to one module. A regression run with --coverage-merge --coverage-html produces the merged LCOV report. See Coverage.
Look at the waveform
rb wave opens the test's trace in Surfer with the suite's saved signal layout, and streams signal values back into your editor over the hub. The same layout file drives headless capture, which is how this image was made:
cd verif/demo_tiny_alu
uv run rb wave basic
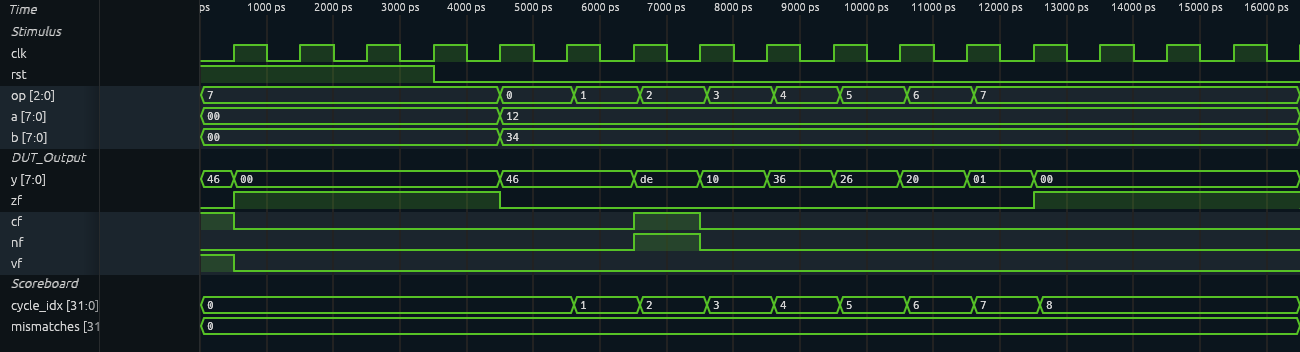
Stimulus, DUT outputs, and the scoreboard's mismatch counter sit in three named groups because tb_top.surfer says so; a new engineer opening the test sees the same thing you do. See Waveform Viewing.
Draw the hierarchy
rb hier renders a model's instance tree from the RTL. The block-diagram form groups siblings and labels the nets between them:
cd design/demo_tiny_alu_subsys
uv run rb hier demo_tiny_alu_subsys_top
uv run rb hier demo_tiny_alu_subsys_top --format dot --block-diagram | dot -Tpng -o subsys.png
demo_tiny_alu_subsys_top
├── u_csr : demo_tiny_alu_subsys_csr
├── u_hs_cmd : ip_cdc_handshake
├── u_afifo : ip_async_fifo
├── u_sync_src : ip_cdc_sync
├── u_compute : demo_tiny_alu_subsys_compute
│   └── u_alu : demo_tiny_alu
├── u_hs_result : ip_cdc_handshake
├── u_hist_mem : demo_tiny_alu_subsys_mem
└── u_sync_empty : ip_cdc_sync
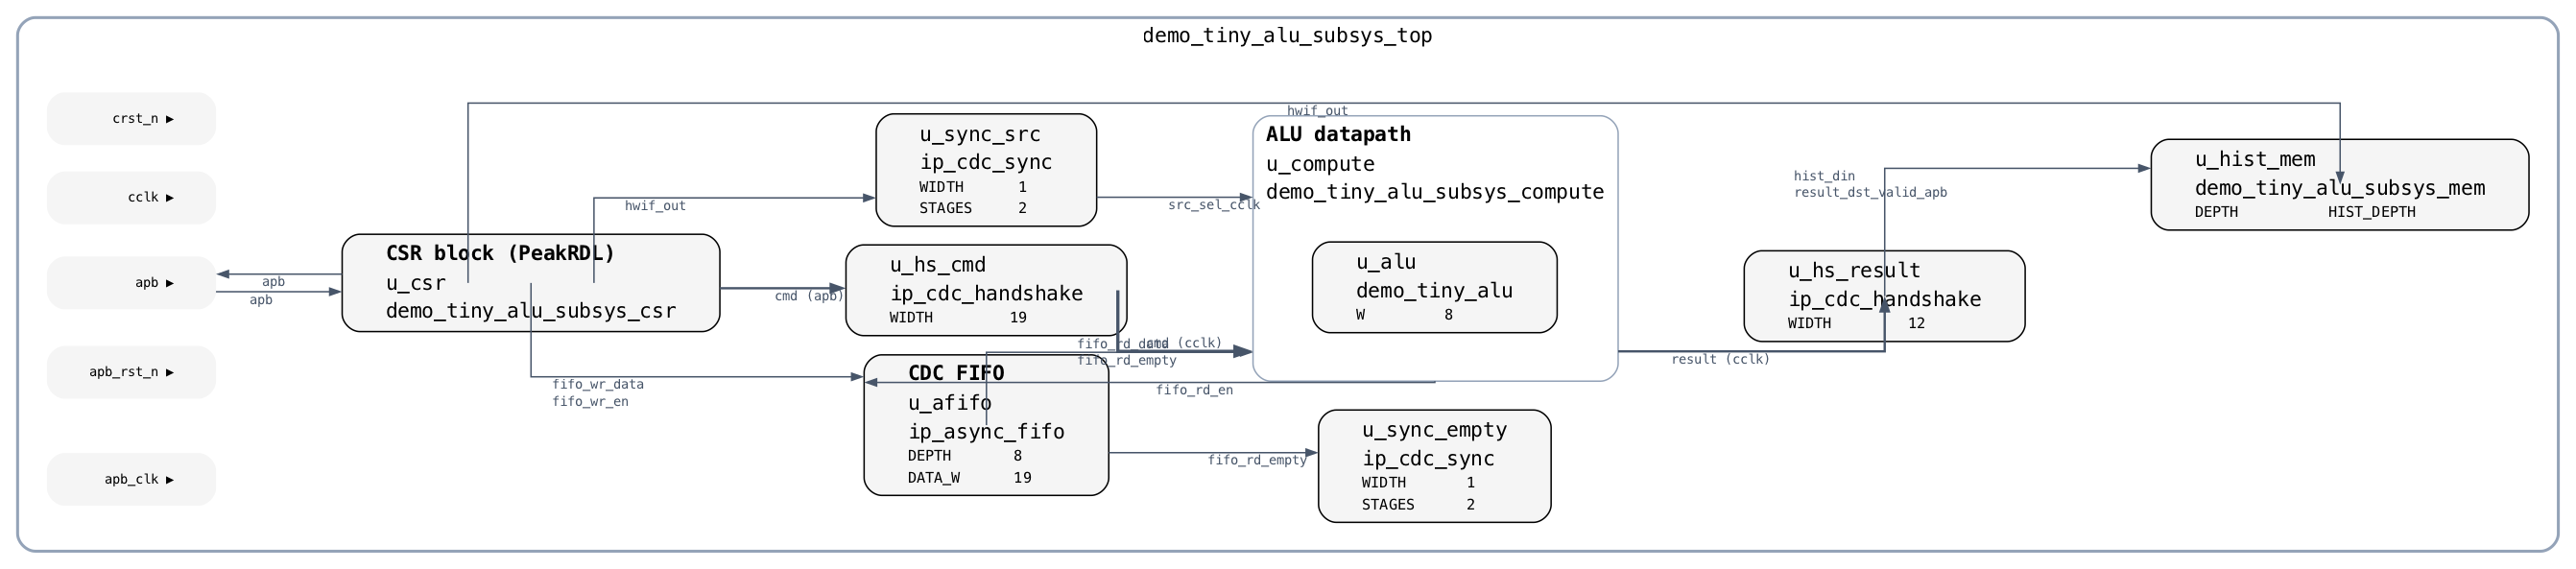
Parameter values on each block come from the elaborated design, not from a drawing. rb hier-query answers the same questions as JSON (see Ask the design questions below), and rb hub serves an interactive schematic of the same hierarchy in the browser. See Hierarchy Rendering.
Lint clock-domain crossings
rb cdc runs rtl-buddy-cdc with the design's SDC and an optional waiver file, and reports every crossing it traced.
uv run rb cdc-regression -c lint/cdc/cdc_regression.yaml
                                     CDC Regression Summary
┏━━━━━━━━━━━━━━━━━━━━━━━━━━━┳━━━━━━━━┳━━━━━━━━━━━━━━━━━━━━━━━━━━━━━━━━━┳━━━━━━━━━━━━┳━━━━━━━━━━━━┳━━━━━━━━━━━┓
┃ CDC Analysis              ┃ Result ┃ Description                     ┃ Violations ┃ Suppressed ┃ Crossings ┃
┡━━━━━━━━━━━━━━━━━━━━━━━━━━━╇━━━━━━━━╇━━━━━━━━━━━━━━━━━━━━━━━━━━━━━━━━━╇━━━━━━━━━━━━╇━━━━━━━━━━━━╇━━━━━━━━━━━┩
│ ip_cdc_handshake_lint     │ PASS   │ no rule violations              │ 0          │ 0          │ 3         │
│ demo_tiny_alu_subsys_lint │ PASS   │ no rule violations (2           │ 0          │ 2          │ 10        │
│                           │        │ suppressed)                     │            │            │           │
│ demo_cdc_src_sync_lint    │ PASS   │ no rule violations              │ 0          │ 0          │ 4         │
│ demo_cdc_open_lint        │ PASS   │ no rule violations              │ 0          │ 0          │ 5         │
│ demo_cdc_mem_macro_lint   │ PASS   │ no rule violations              │ 0          │ 0          │ 3         │
└───────────────────────────┴────────┴─────────────────────────────────┴────────────┴────────────┴───────────┘
                                          Reg Level: 0
                                   Results: 5 PASS (5 total)
The subsystem's ten crossings are the two handshakes, the async FIFO, and the two level synchronizers in the diagram above. Each crossing is also written to cdc.json with its source and destination flop, width, and synchronizer depth, so the two suppressed findings are auditable rather than silent. See the rtl-buddy-cdc rule set and the FPGA page's CDC constraint check for the flow around it.
Prove properties
rb fpv drives SymbiYosys and reports more than pass or fail. Vacuity, cone-of-influence, and dead-assume checks tell you whether a passing proof actually constrained anything.
cd fpv/demo_abv/demo_abv_features
uv run rb fpv
                                            FPV Results Summary
┏━━━━━━━━━━━━━━━━━┳━━━━━━━━┳━━━━━━━━━━━━━━━━━┳━━━━━━┳━━━━━━━┳━━━━━━━━━━━━━━┳━━━━━━━━━━━━━┳━━━━━━━━━━━━━┳━━━━━━━━━━━━━━━━┓
┃ FPV Run         ┃ Result ┃ Description     ┃ Mode ┃ Depth ┃ Engines      ┃ Vacuity     ┃ COI         ┃ Assumes        ┃
┡━━━━━━━━━━━━━━━━━╇━━━━━━━━╇━━━━━━━━━━━━━━━━━╇━━━━━━╇━━━━━━━╇━━━━━━━━━━━━━━╇━━━━━━━━━━━━━╇━━━━━━━━━━━━━╇━━━━━━━━━━━━━━━━┩
│ …features_safety│ PASS   │ property proved │ bmc  │ 32    │ smtbmc yices │ -           │ 89% (8/9)   │ 0 used, 1 dead │
│ …features_vacuit│ PASS   │ property proved │ bmc  │ 32    │ smtbmc yices │ 1/2 vacuous │ 94% (16/17) │ 0 used, 1 dead │
└─────────────────┴────────┴─────────────────┴──────┴───────┴──────────────┴─────────────┴─────────────┴────────────────┘
                                         Results: 2 PASS (2 total)
Both runs pass, and both have something to fix: one assumption is dead in each, and one of the two vacuity properties never had its antecedent reached. Those are the findings a bare sby run hides. A failed proof gets rb wave-fpv to open the counterexample trace in Surfer. See Formal property verification.
Score the testbench with mutants
rb mut injects one bug at a time into a design file and asks whether the proof (or a simulation oracle) catches it. The score is the fraction caught.
cd fpv/demo_abv/demo_abv_basic
uv run rb mut run
                                        Mutation Testing Results
┏━━━━━━━━━━━━━━━━━━━┳━━━━━━━━━━━━━┳━━━━━━━━━━┳━━━━━━━━━━┳━━━━━━━━━━━━━━━━━━━┳━━━━━━━━━━━━━━━━━━━━━━━━━━━━━━━━━━━┓
┃ Mutant            ┃ Operator    ┃ Outcome  ┃ Verdict  ┃ Predicted Signals ┃ Mutation                          ┃
┡━━━━━━━━━━━━━━━━━━━╇━━━━━━━━━━━━━╇━━━━━━━━━━╇━━━━━━━━━━╇━━━━━━━━━━━━━━━━━━━╇━━━━━━━━━━━━━━━━━━━━━━━━━━━━━━━━━━━┩
│ m0000_arith_flip  │ arith_flip  │ SURVIVED │ fpv=PASS │ -                 │ line 17: `+` -> `-`               │
│ m0001_cond_negate │ cond_negate │ KILLED   │ fpv=FAIL │ -                 │ line 32: negate if cond `en && …` │
│ m0002_cond_const  │ cond_const  │ KILLED   │ fpv=FAIL │ -                 │ line 30: force if cond `!rst_n` … │
│ m0003_assign_drop │ assign_drop │ KILLED   │ fpv=FAIL │ cnt               │ line 31: drop `cnt <= ...;`       │
│ m0007_assign_drop │ assign_drop │ SURVIVED │ fpv=PASS │ cnt               │ line 33: drop `cnt <= ...;`       │
│ m0011_cond_const  │ cond_const  │ SURVIVED │ fpv=PASS │ -                 │ line 32: force if cond … -> `0`   │
└───────────────────┴─────────────┴──────────┴──────────┴───────────────────┴───────────────────────────────────┘
                              Mutation score: 58.3% (killed 7 / scored 12)
                             Survived: 5   Errored: 0   Baseline: fpv=PASS
                    Predicted-observable misses (weak properties): m0007_assign_drop
Rows above are a subset of the twelve mutants. The last line is the actionable one: mutant m0007 changes a signal the properties can observe and still survived, so the property set is weak there, not merely blind. The full matrix is also written as mut_report.json. See Mutation testing.
Synthesize
rb synth runs Yosys from a synth.yaml entry, generic or Liberty-mapped, and reports gate count, area, and worst slack when a library and SDC are present.
uv run rb synth-regression -c synth_regression.yaml
uv run rb synth demo_tiny_alu_subsys_synth_nangate45 -c synth/demo_tiny_alu_subsys/synth.yaml
                           Synthesis Regression Summary
┏━━━━━━━━━━━━━━━━━━━━━━━━━━━━━━━━━━━━━━━━━━┳━━━━━━━━┳━━━━━━━━━━━━━━━━━━━━━━━━━━━━┳━━━━━━━┓
┃ Synthesis                                ┃ Result ┃ Description                ┃ Gates ┃
┡━━━━━━━━━━━━━━━━━━━━━━━━━━━━━━━━━━━━━━━━━━╇━━━━━━━━╇━━━━━━━━━━━━━━━━━━━━━━━━━━━━╇━━━━━━━┩
│ demo_tiny_alu_synth_generic              │ PASS   │ Synthesis passed           │ 287   │
│ demo_tiny_alu_subsys_synth_generic       │ PASS   │ Synthesis passed           │ 3847  │
│ demo_cdc_src_sync_synth_generic          │ PASS   │ Synthesis passed           │ 13    │
│ demo_synth_incdir_synth_generic          │ PASS   │ Synthesis passed           │ 42    │
│ demo_synth_macro_generic                 │ PASS   │ Synthesis passed           │ 16    │
└──────────────────────────────────────────┴────────┴────────────────────────────┴───────┘

                                  Synthesis Results Summary
┏━━━━━━━━━━━━━━━━━━━━━━━━━━━━━━━━━━━━━━┳━━━━━━━━┳━━━━━━━━━━━━━━━━━━┳━━━━━━━┳━━━━━━━━━━━━━┳━━━━━━━━━━━┓
┃ Synthesis                            ┃ Result ┃ Description      ┃ Gates ┃ Area        ┃ WNS       ┃
┡━━━━━━━━━━━━━━━━━━━━━━━━━━━━━━━━━━━━━━╇━━━━━━━━╇━━━━━━━━━━━━━━━━━━╇━━━━━━━╇━━━━━━━━━━━━━╇━━━━━━━━━━━┩
│ demo_tiny_alu_subsys_synth_nangate45 │ PASS   │ Synthesis passed │ 3879  │ 8345.48 µm² │ +5.363 ns │
└──────────────────────────────────────┴────────┴──────────────────┴───────┴─────────────┴───────────┘
The Nangate45 run is the input to the next two sections. Per-module cell counts and areas from every synthesis run are kept in a physical model that rb phys queries later without rerunning the tool. See Synthesis and Physical Metrics.
Place and route
rb pnr takes the mapped netlist and SDC through OpenROAD floorplan, placement, clock tree, and routing, then reports timing, DRC, and electrical violations in one row. rb pnr-export streams the result to GDS and renders it with KLayout.
uv run rb pnr demo_tiny_alu_subsys_pnr_nangate45 -c pnr/demo_tiny_alu_subsys/pnr.yaml -l 1000
uv run rb pnr-export demo_tiny_alu_subsys_pnr_nangate45 -c pnr/demo_tiny_alu_subsys/pnr.yaml -l 1000 --png
                                                      P&R Results Summary
┏━━━━━━━━━━━━━━━━━━━━━━━━━━━━━━━━━━┳━━━━━━━━┳━━━━━━━━━━━━━━━━━━━━━━━━━━━━━━━━┳━━━━━━━┳━━━━━━━━━━━━━┳━━━━━━━━━━━┳━━━━━━━━━━━┳━━━━━━┳━━━━━━━━━━━━━━━━━┓
┃ P&R Run                          ┃ Result ┃ Description                    ┃ Cells ┃ Area        ┃ WNS Setup ┃ WNS Hold  ┃ DRCs ┃ Slew/Cap/Fanout ┃
┡━━━━━━━━━━━━━━━━━━━━━━━━━━━━━━━━━━╇━━━━━━━━╇━━━━━━━━━━━━━━━━━━━━━━━━━━━━━━━━╇━━━━━━━╇━━━━━━━━━━━━━╇━━━━━━━━━━━╇━━━━━━━━━━━╇━━━━━━╇━━━━━━━━━━━━━━━━━┩
│ demo_tiny_alu_subsys_pnr_nangat… │ PASS   │ P&R passed; pnr.no_wire_rc:    │ 3879  │ 8656.00 µm² │ +4.620 ns │ +0.030 ns │ 0    │ 1/50/0          │
│                                  │        │ pre-route steps saw no wire RC │       │             │           │           │      │                 │
│                                  │        │ (no layer-rc-tcl, EST-0018,    │       │             │           │           │      │                 │
│                                  │        │ CTS-0104); see rb docs show    │       │             │           │           │      │                 │
│                                  │        │ concepts/pnr#set-wire-rc;      │       │             │           │           │      │                 │
│                                  │        │ electrical 1 max-slew, 50      │       │             │           │           │      │                 │
│                                  │        │ max-capacitance violator(s)    │       │             │           │           │      │                 │
└──────────────────────────────────┴────────┴────────────────────────────────┴───────┴─────────────┴───────────┴───────────┴──────┴─────────────────┘
                                                   Results: 1 PASS (1 total)
The description column names the warnings the flow saw (here, pre-route steps estimated without wire RC) and points at the concept page that explains each one. The routed DEF, ODB, netlist, SDC, and reports stay in the run's artefact directory for the next step. See Place-and-Route.
Analyze power
rb power runs OpenROAD power analysis on either the synthesized or the routed netlist, with activity from a default, a synthetic toggle rate, or a SAIF captured from a real simulation. rb saif makes the SAIF from a test's FST.
(cd verif/demo_tiny_alu_subsys && uv run rb test csr_smoke)
uv run rb saif verif/demo_tiny_alu_subsys/artefacts/csr_smoke/dump.fst \
               verif/demo_tiny_alu_subsys/artefacts/csr_smoke/dump.saif
uv run rb power -c power/demo_tiny_alu_subsys/power.yaml -l 1000
                                             Power Results Summary
┏━━━━━━━━━━━━━━━┳━━━━━━━━┳━━━━━━━━━┳━━━━━━━━┳━━━━━━━━━━━┳━━━━━━━━━━━━┳━━━━━━━━━━┳━━━━━━━━━━┳━━━━━━━━━━━━┳━━━━━━━━━━━━┓
┃ Power Run     ┃ Result ┃ Mode    ┃ Source ┃ Activity  ┃ Parasitics ┃ Total    ┃ Internal ┃ Switching  ┃ Leakage    ┃
┡━━━━━━━━━━━━━━━╇━━━━━━━━╇━━━━━━━━━╇━━━━━━━━╇━━━━━━━━━━━╇━━━━━━━━━━━━╇━━━━━━━━━━╇━━━━━━━━━━╇━━━━━━━━━━━━╇━━━━━━━━━━━━┩
│ …power_static │ PASS   │ static  │ synth  │ default   │ -          │ 1.800 mW │ 1.340 mW │ 316.000 µW │ 149.000 µW │
│ …power_dynamic│ PASS   │ dynamic │ synth  │ synthetic │ -          │ 1.480 mW │ 1.030 mW │ 279.000 µW │ 162.000 µW │
│ …power_saif   │ PASS   │ dynamic │ synth  │ saif      │ -          │ 2.590 mW │ 1.880 mW │ 562.000 µW │ 151.000 µW │
│ …power_postpnr│ PASS   │ dynamic │ pnr    │ saif      │ estimated  │ 2.810 mW │ 1.750 mW │ 906.000 µW │ 159.000 µW │
└───────────────┴────────┴─────────┴────────┴───────────┴────────────┴──────────┴──────────┴────────────┴────────────┘
                                          Results: 4 PASS (4 total)
Four activity sources, one table. The jump in switching power from the synthetic run to the SAIF run is the real traffic from csr_smoke; the further jump after P&R is the clock tree and estimated wire parasitics. See Power Analysis.
Profile an interconnect
rb axi-profile discovers AXI bundles from the RTL, binds a monitor into the simulation, and turns the trace into per-channel utilization, back-pressure, latency percentiles, and a per-transaction table.
cd verif/demo_axi_2x2
uv run rb test basic_traffic
uv run rb axi-profile run basic_traffic
wrote artefacts/axi/basic_traffic/axi-perf.json (4 bundles, 3210 cycles, clock=tb_axi_2x2.clk).
For the in0 bundle of the 2×2 crossbar, the write-data channel reports 55% back-pressure against 4.8% utilization, which is the deliberate stall the testbench injects. rb axi-profile notebook opens the same data in a packaged marimo notebook, and the hub overlays it on the schematic. See AXI Interconnect Profiling.
Browse it live in the hub
rb hub is a small daemon that serves four browser panes over the artefacts the sections above produced, and keeps them, Surfer, and your editor pointed at the same thing. One client per pane; a click in any of them selects in the others.
uv run rb graph build
uv run rb hub start --serve-viewer --model demo_tiny_alu_subsys_top \
    --models-file design/demo_tiny_alu_subsys/models.yaml
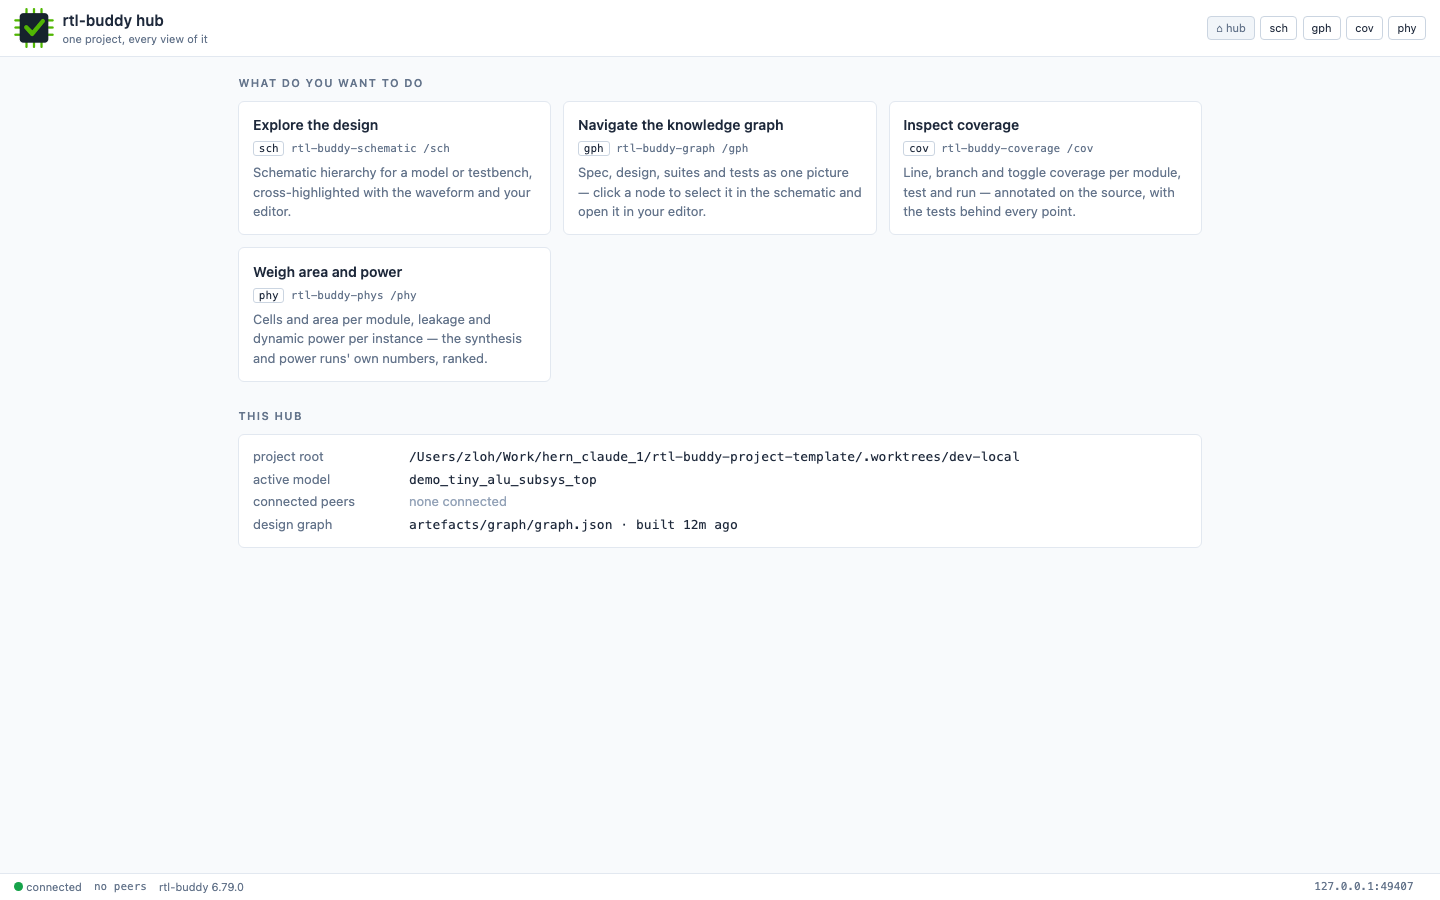
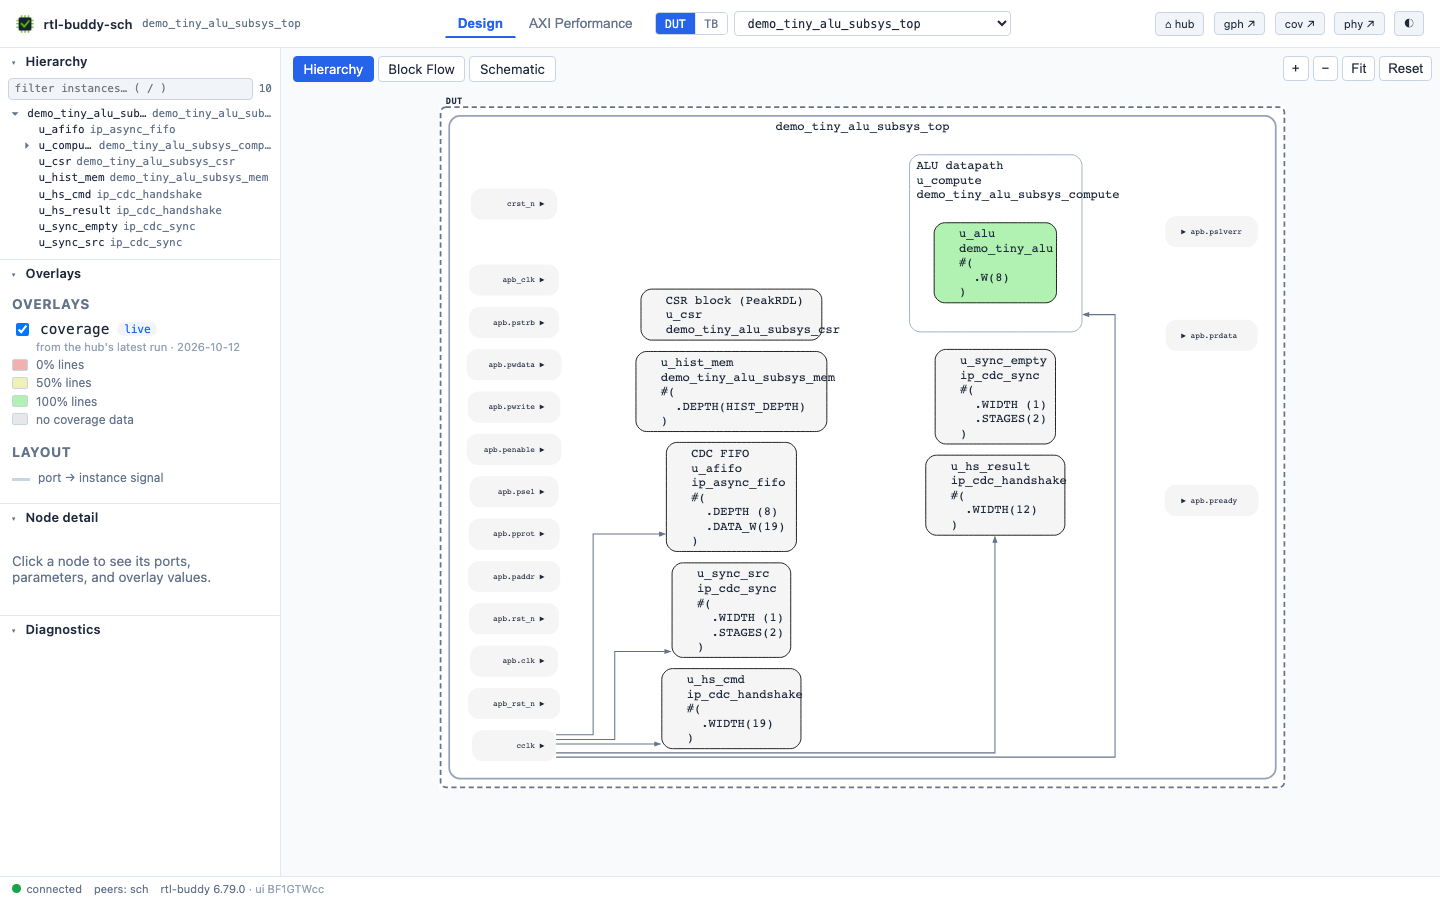
Schematic (/sch). The hierarchy from rb hier, drawn by rtl-buddy-sch with a DUT or testbench root, an instance filter, and overlays. The coverage overlay below colours each block by line coverage from the latest run; only the ALU under u_compute has a coverage run behind it, so only it is green:
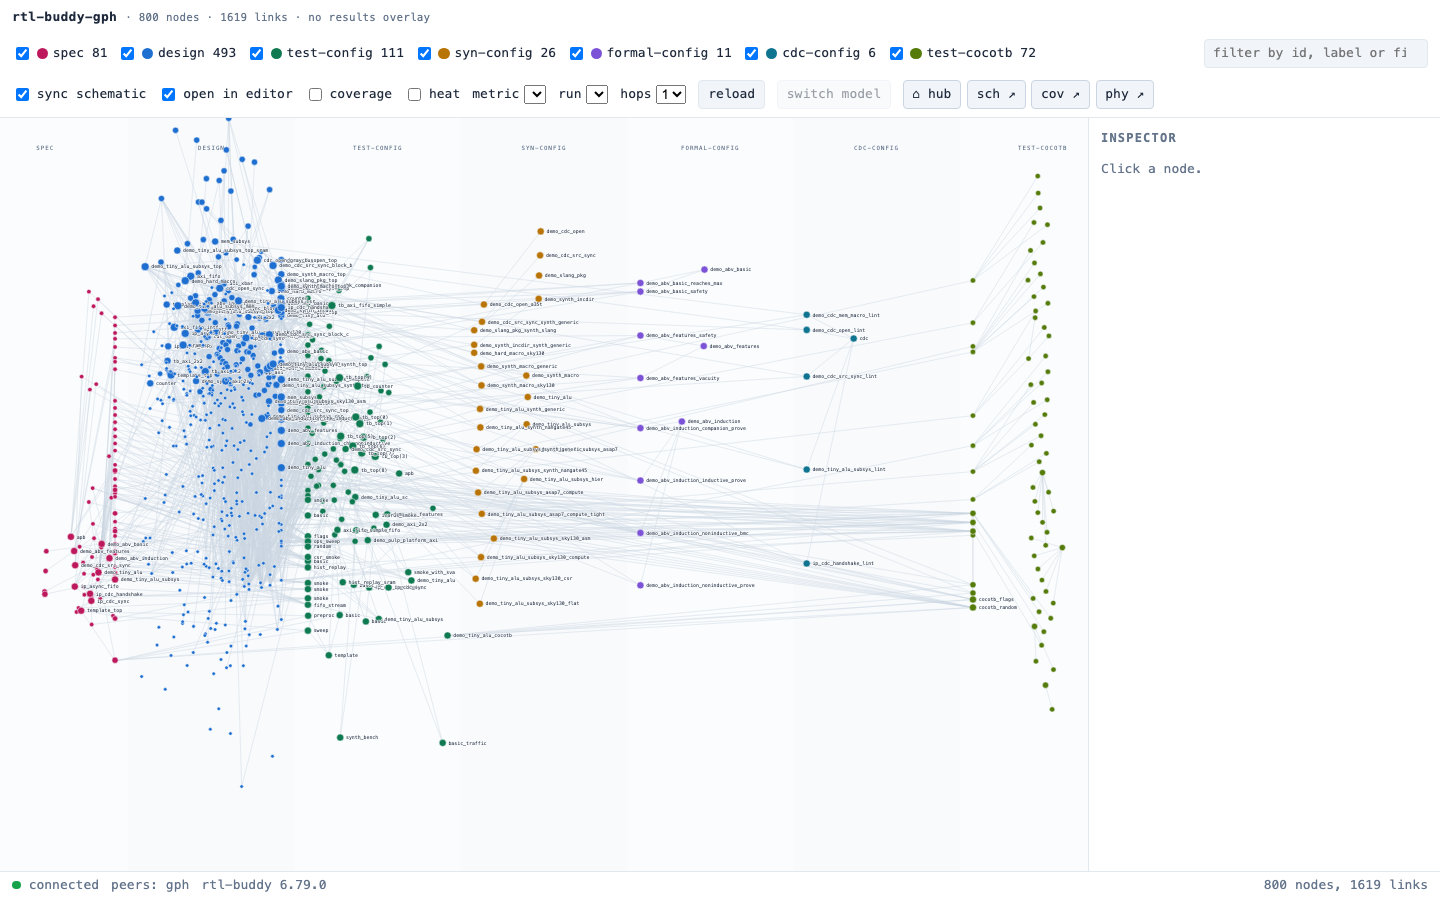
Knowledge graph (/gph). The 800-node graph from rb graph build, laid out by tier: spec, design, test config, synthesis config, formal config, CDC config, and cocotb. Clicking a node selects it in the schematic and opens its source in the editor:
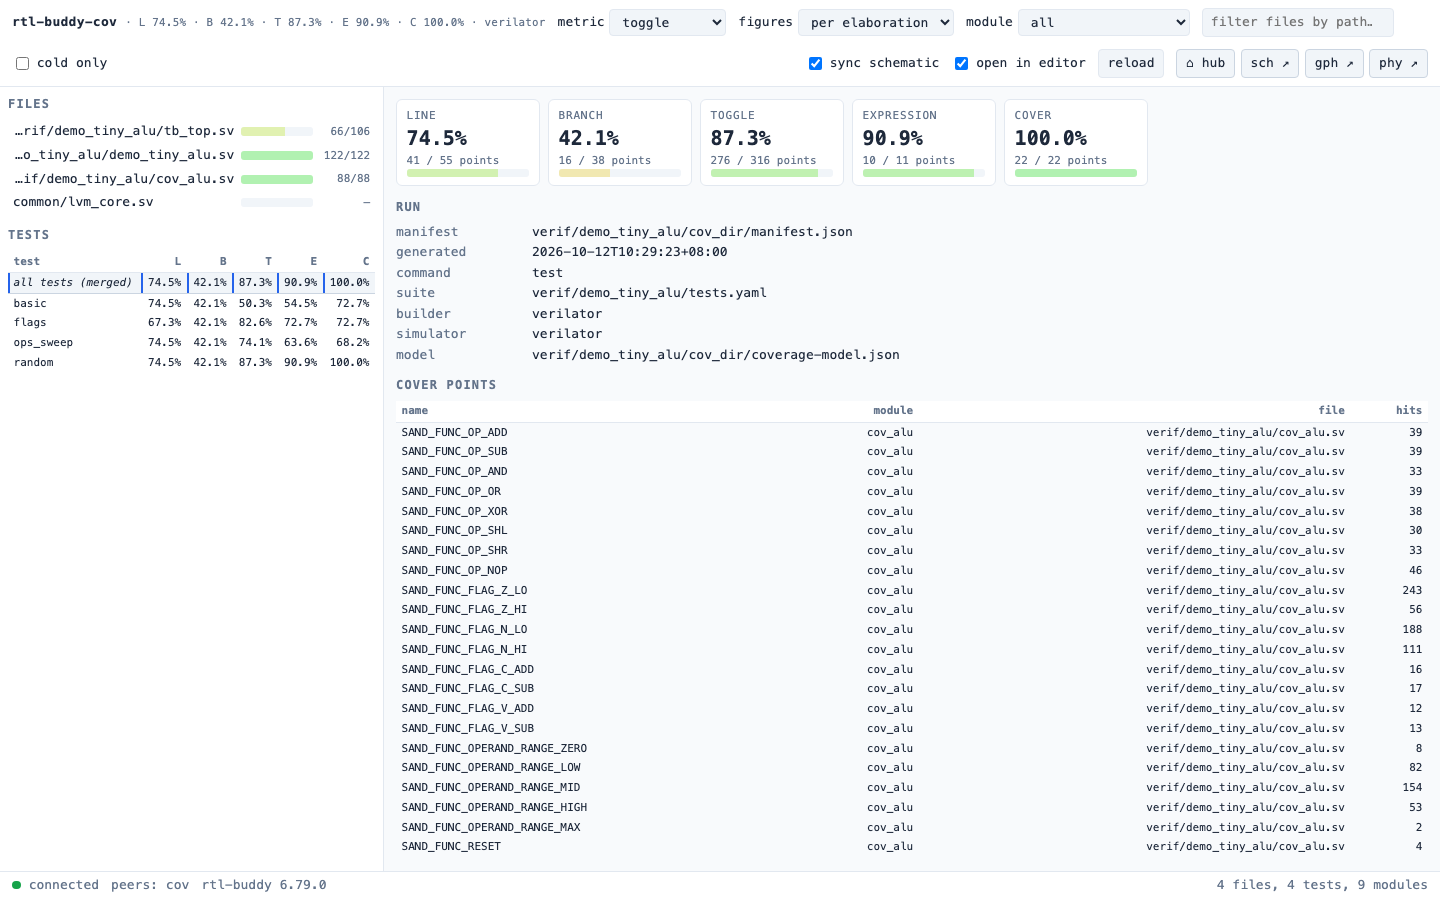
Coverage (/cov). The same manifest rb cov summary reads, with per-test columns, per-file bars, and every cover point with its hit count. A click on a source line sets the coverage focus everywhere else:
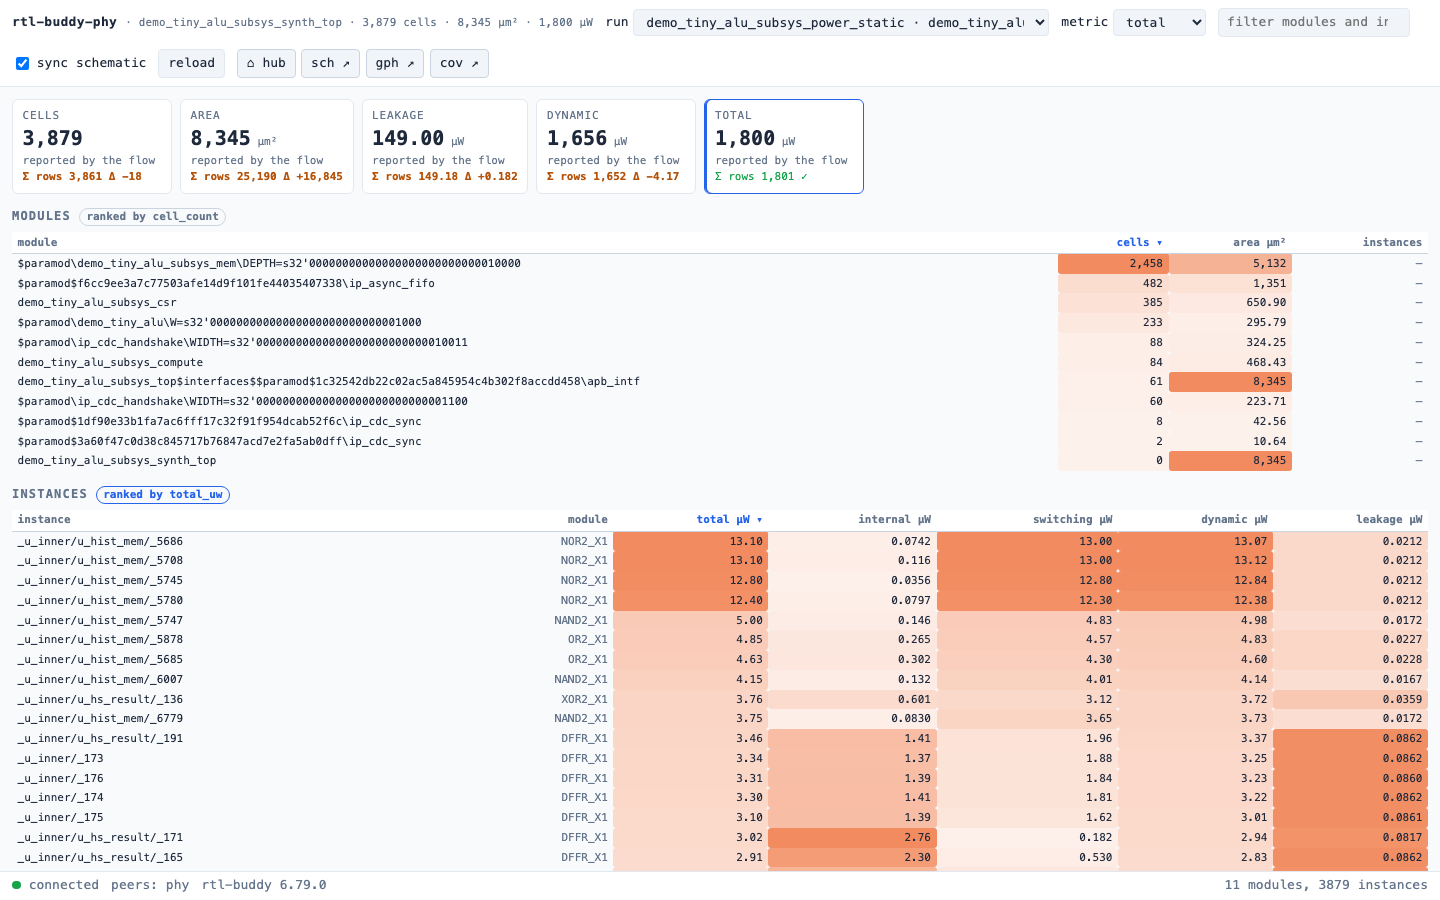
Area and power (/phy). The physical model that rb synth and rb power wrote, ranked by cells and by instance power, with the run selector at the top switching between the four power runs:
Every pane is one self-contained HTML file served from the wheel, so the hub needs no network access and no build step. rb hub send scripts the same selections from a terminal, and rb mcp exposes the hub's state to an agent. See Hub.
Annotate your editor
The Neovim plugin is the editor side of the hub. rb nvim-install clones rtl-buddy-nvim and wires it in with one command; the plugin composes with verible-verilog-ls rather than replacing it.
uv run rb nvim-install
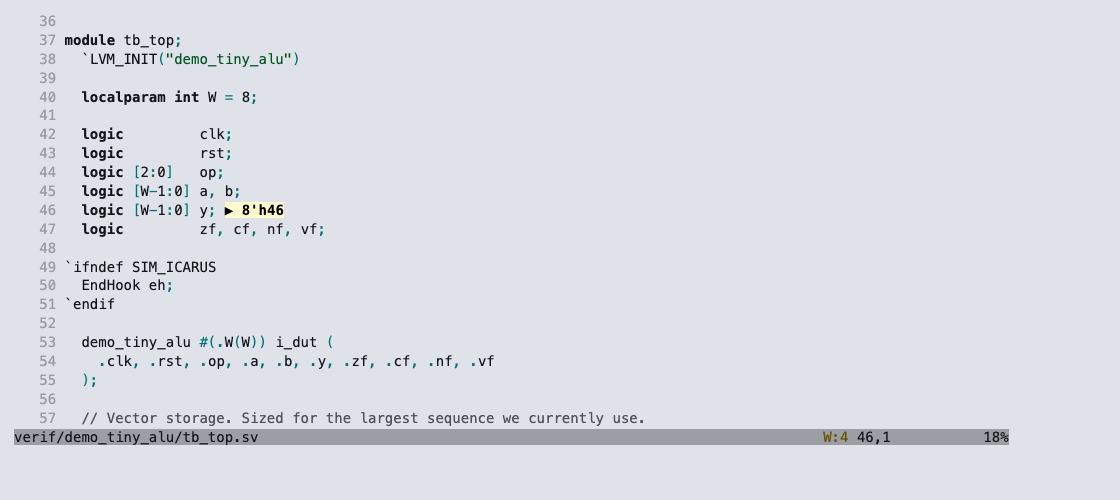
Two annotations appear without any hub running. rb wave launches Neovim with the selected signal's value as virtual text at its declaration, and <leader>wa adds the signal under the cursor to the Surfer waveform:
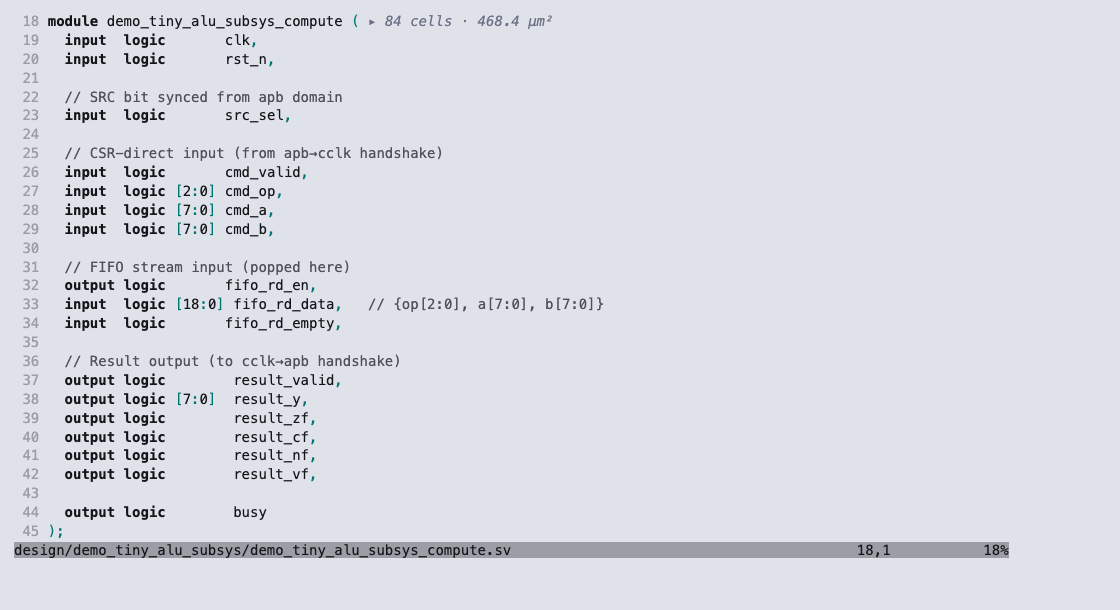
Every module declaration carries its synthesized cell count and area, read from the same physical model the /phy pane shows, through one rb --machine phys summary call per project:
With the hub connected, a click on a schematic instance opens its file at the right line, :RtlBuddyShow pans the schematic and Surfer to the cursor, and :RtlBuddyToWave adds the symbol under the cursor to the waveform. Both captures above are the real Neovim screen grid, rendered through the UI protocol. See Install the nvim integration.
Ask the design questions
Everything above also answers in JSON. --machine turns any command's console into a structured payload, rb hier-query and rb graph answer questions about the design directly, and rb docs serves this documentation offline for the installed version.
cd verif/demo_tiny_alu
uv run rb --machine test basic
{"command": "test", "exit_code": 0, "payload": {"results": [{"name": "basic", "result": "PASS", "desc": "(nwrn= 0)"}]}}
cd design/demo_tiny_alu_subsys
uv run rb --machine hier-query demo_tiny_alu_subsys_top instances-of ip_cdc_handshake
[{"instance_path": "demo_tiny_alu_subsys_top.u_hs_cmd", "module_name": "ip_cdc_handshake",
  "param_overrides": [{"param_name": "WIDTH", "value_text": "19",
    "location": {"file": ".../demo_tiny_alu_subsys_top.sv", "start_line": 92}}],
  "location": {"file": ".../design/common/ip_cdc_handshake.sv", "start_line": 28, "end_line": 96}},
 {"instance_path": "demo_tiny_alu_subsys_top.u_hs_result", "module_name": "ip_cdc_handshake",
  "param_overrides": [{"param_name": "WIDTH", "value_text": "12", "...": "..."}]}]
The design knowledge graph joins specs, RTL, tests, and coverage, so a question that crosses those boundaries is one query:
uv run rb graph build
uv run rb graph query "which tests cover SAND-FUNC-FLAG-C-ADD"
covitem:demo_tiny_alu#SAND-FUNC-FLAG-C-ADD
  <- declares spec:demo_tiny_alu
  <- covers test:verif/demo_tiny_alu#flags
  <- covers test:verif/demo_tiny_alu_cocotb#cocotb_flags
The graph was built from this project in a few seconds: 800 nodes and 1619 links across RTL, config, spec, and cocotb binding tiers. rb mcp exposes the same graph, coverage, physical-metrics, and hierarchy queries as MCP tools, and rb skill install gives Claude Code or Codex a version-matched skill that knows every command on this page. See Agent use of rtl-buddy and Design Knowledge Graph.
Where to next
- Installation installs RTL Buddy and maps each section above to the external tools it needs.
- Quick Start runs the same commands in your own project.
- Root Config and Tests show the YAML behind the first three sections.